Previous: Hardware vs. Software Rendering, Up: Graphics Toolkits [Contents][Index]
15.4.8.3 Precision issues
The OpenGL graphics toolkits ("qt" and "fltk") use single
precision for rendering. This limitation in particular applies to plots of
time series against serial dates as used by the datenum, datestr,
datestruct, and datetick functions.
Serial dates encode timestamps as days elapsed since the year zero with hours, minutes, seconds as the fractional part. On December 31st 1999, the serial date representation was 730485. A double precision variable with this integer part allows for a resolution in its fractional part of 1.2e-10, representing about 5 microseconds. But with single precision, the resolution is reduced to about 0.06, representing 45 minutes. Any attempt to plot timestamped data with finer granularity will result in a distorted graph.
As a workaround, it is possible to use the "gnuplot" graphics toolkit
or subtract 2000 years—i.e., datenum (2000, 0, 0) or 730485—from the
time values. Due to the fact that the calendar structure repeats every 2000
years, the relation between year, month, day of month and day of week will stay
unchanged and the ticks and ticklabels produced by the datetick function
will still be correct. Only years will lack the millennium digit. Thus,
"2020" will be printed as "20". For example:
# timestamps of 24 hours in one minute steps
t = datenum (2020, 1, 1):(1/1440):datenum (2020, 1, 2);

# some example time series data
x = -cos (2*pi*t) + rand (size (t)) / 10;

subplot (1, 2, 1);
plot (t, x);
datetick ("x");
xlabel ("serial date");
title ("problem");

subplot (1, 2, 2);
plot (t - 730485, x);
datetick ("x");
xlabel ("2000 years off");
title ("workaround");
The result of which can be seen in Figure 15.8.
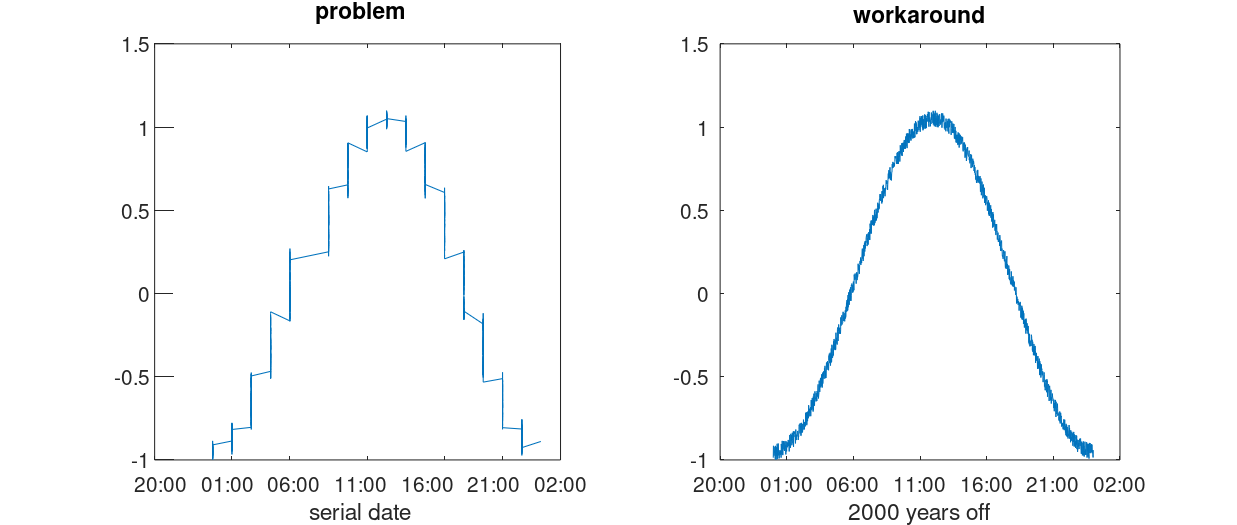
Figure 15.8: Single precision issues with OpenGL graphics toolkits
Similarly, other data can be translated or re-scaled to work around this issue.